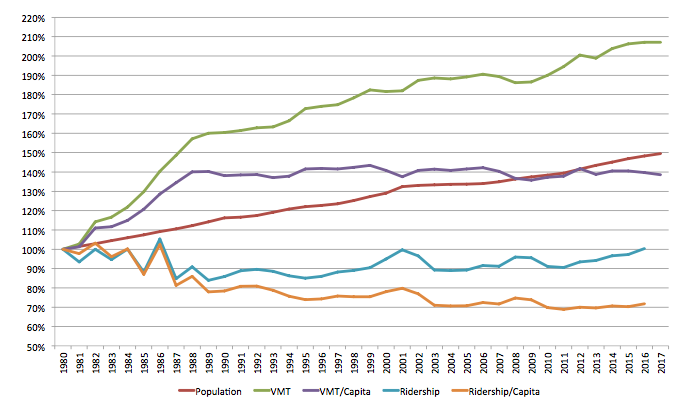
A updating of data of the chart on our Bay Area Basics page shows that MTC is continuing to fail at fostering any kind of change in Bay Area travel habits. As a result, the total amount of driving, VMT, has more than doubled since 1980. That’s why the roads keep feeling more crowded. They are!

Key Bay Area Transportation Statistics (compared to 1980 levels)
Note in particular the flat VMT per capita trace, indicating no change in the propensity to drive. This is the direct result of MTC’s failure to supply alternatives to driving. Despite spending many billions of dollars on BART extensions, total transit ridership actually dropped in the Bay Area during the 1990s. While total ridership has been rising since 2011, this is not a success story–it is only now getting back to 1980 levels. In the meanwhile, a far smaller percentage of the population is using transit than was the case in 1980. If there is good news here, it is that this transit ridership per capita statistic has stopped dropping–but note that it is not increasing. It will need to increase significantly, along with a corresponding drop in VMT per capita, if the Bay Area is to avoid total gridlock.
These traces indicate that MTC has continued a heavily auto-oriented policy. Its funding allocations are geared towards support of auto travel, short-changing the cost-effective quality transit needed to encourage significantly more people to use transit rather than drive. See Minneapolis and Seattle for the alternative.
Sources: MTC Statistical Summary, Caltrans HPMS Table of Daily VMT by MPO, Department of Finance E-4 Population Estimates